
Quick answer
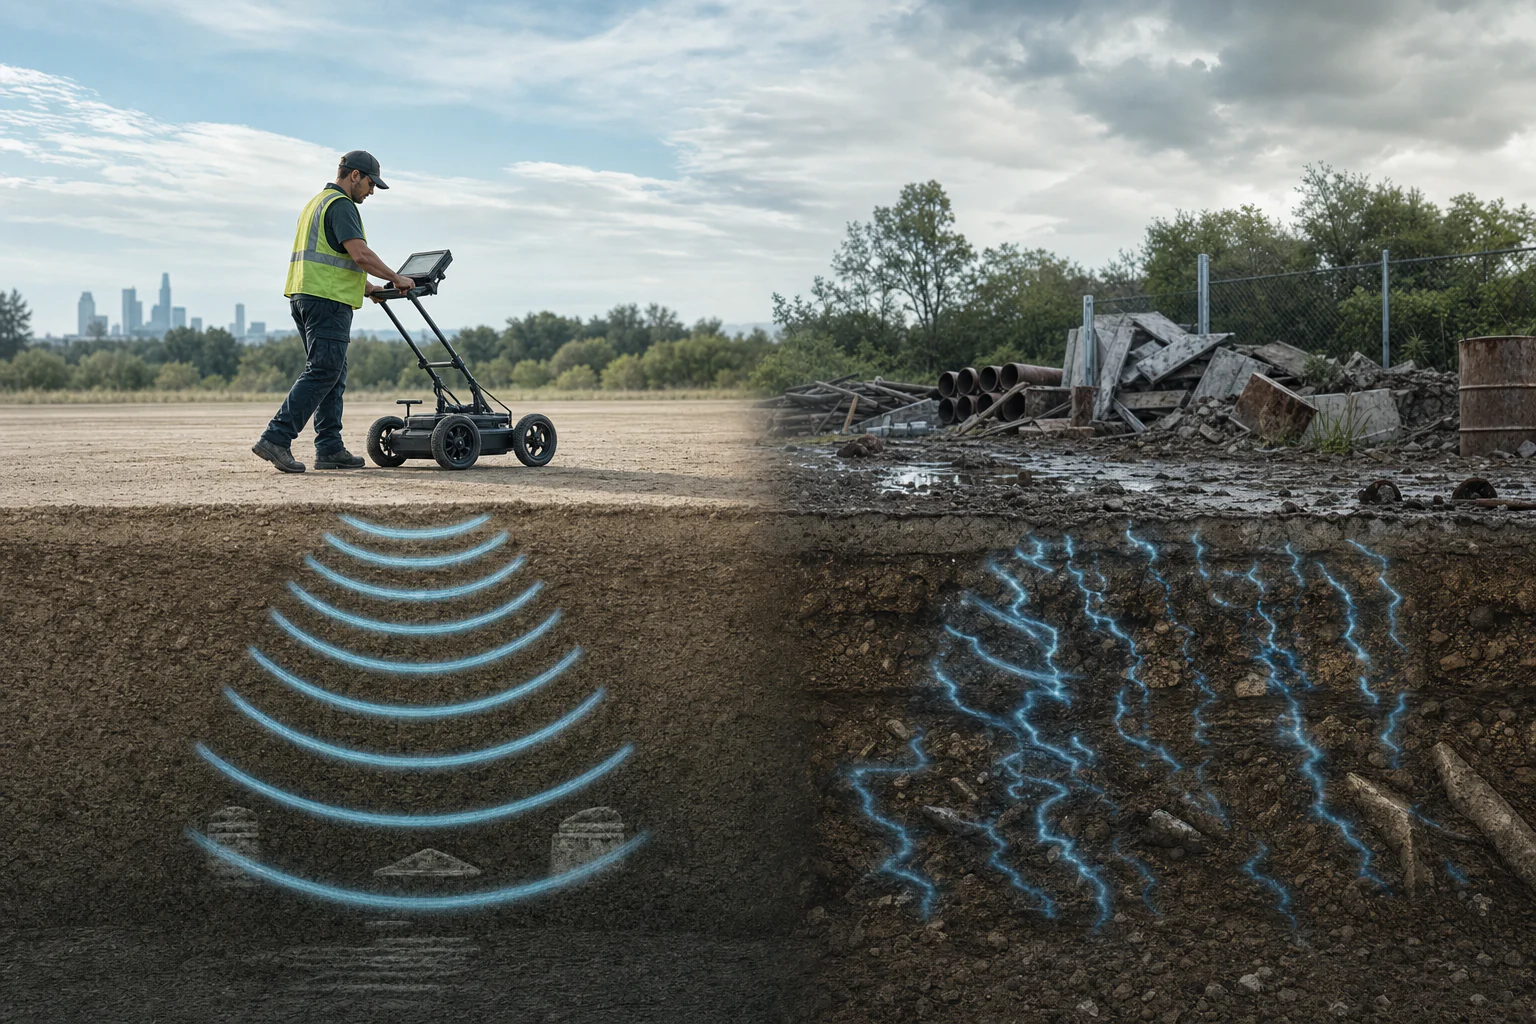
Ground penetrating radar, or GPR, can provide high-resolution near-surface information where electromagnetic energy can penetrate the ground and the target creates a sufficient contrast in electrical properties. It performs best when target size, depth, antenna frequency, surface access, and host-ground conditions are compatible. Conductive materials such as saline water and many clay-rich soils can strongly attenuate the signal. A radar reflector is not automatically a pipe, void, water table, defect, or geological boundary.
What the topic means
GPR transmits short electromagnetic pulses into the ground and records returning energy from interfaces or objects that contrast in electromagnetic properties. The primary record is amplitude versus two-way travel time along a line or grid. Converting time to depth requires a defensible wave velocity or dielectric-permittivity basis. Processing can improve interpretability but also changes the display, so raw, corrected, filtered, gained, migrated, and interpreted states must remain distinguishable.
When it may be relevant
- Shallow stratigraphy, layer geometry, pavement, slab, or foundation-related screening.
- Locating possible discrete buried objects, utilities, reinforcement, or disturbed zones where suitability and safety controls allow.
- Investigating near-surface karst, void, moisture, bedrock, ice, or archaeological contexts with suitable ground conditions.
- Planning confirmatory excavation, coring, utility verification, sampling, or other targeted investigation.
Useful information and inputs
- Target type, size, orientation, expected depth, required positional tolerance, and consequence of a missed or false target.
- Surface material, roughness, slope, access, obstructions, traffic, reinforcement, and nearby radio or electrical interference.
- Expected clay, salinity, moisture, conductivity, and geological conditions in the host ground.
- Survey line or grid coordinates, trace spacing, antenna frequency, time window, trigger and positioning method.
- Known-depth targets, common-midpoint data, excavations, cores, utility records, or other velocity and interpretation controls.
How the method or assessment generally works
A feasibility review tests whether the target should produce a detectable contrast at the required depth and resolution. Antenna frequency, line spacing, grid orientation, trace interval, time window, stacking, positioning, and calibration are selected accordingly. Field data are checked for coupling, ringing, clipping, saturation, position errors, skipped or repeated traces, air and ground waves, cultural noise, and coverage gaps.
Processing uses the least transformation needed for the decision and records every parameter. Velocity is estimated from a known-depth target, common-midpoint or wide-angle measurement, hyperbola fitting, or—when no better evidence exists—a clearly labeled scenario. Interpretation describes reflector geometry, continuity, amplitude, attenuation, and diffraction before assigning possible causes.
Typical outputs
- Feasibility, survey geometry, coverage, and acquisition-quality record.
- Raw or minimally processed and processed radargram comparisons.
- Processing log and velocity or time-depth calibration basis.
- Anomaly plan and register with stable IDs, observations, alternatives, and limitations.
- Confirmation or clearance actions appropriate to the consequence of the target.
How the outputs should be interpreted
Radar reflections indicate electromagnetic contrast, not a unique material identity. Hyperbolic shapes may be produced by discrete objects but require position, velocity, geometry, and corroboration to identify the object. A quiet or attenuated zone may reflect conductive ground, poor coupling, scattering, processing, or limited penetration rather than a void. Depth values are scenario-based whenever velocity has not been measured or adequately calibrated.
QA/QC and evidence checks
- Confirm antenna, frequency, time-zero, time window, trace interval, line direction, coordinates, and units.
- Keep raw data and disclose dewow, filtering, background removal, gain, migration, resampling, topographic correction, and normalization.
- Test velocity with known-depth or direct calibration where possible and show depth sensitivity when it remains uncertain.
- Check line and grid coverage, positional drift, interference, surface coupling, penetration loss, and masked intervals.
- Cross-check anomaly IDs, stationing, time, depth basis, plan position, interpretation, and confirmation status.
Limitations and common misunderstandings
Higher antenna frequency generally improves resolution while reducing penetration; lower frequency may penetrate farther with less detail, but site conductivity can dominate both. Wet clay and saline conditions may reduce penetration severely. Surface metal, vehicles, fences, buildings, overhead or buried services, and nearby transmitters can create interference. GPR screening must not be treated as excavation clearance, and a visually strong response is not proof of target identity.
What may be needed for confirmation
Confirmation may include controlled excavation, potholing by an appropriate utility-verification process, coring, boreholes, test pits, known-depth calibration, as-built records, electromagnetic locating, electrical resistivity, laboratory testing, or repeated surveys from another orientation. Safety-critical utility work requires the applicable authority and clearance procedures beyond GPR interpretation.
What to prepare before contacting HydroGeo
- A target list with expected size, depth, material, orientation, and required decision tolerance.
- Site plans, utility or as-built records, known depths, accessible survey areas, and surface photographs.
- Known clay, salinity, moisture, reinforcement, interference, traffic, and safety constraints.
- The intended confirmation or clearance method if an anomaly is identified.
Project-planning reference
Evidence table and decision graph
Use these source-derived summaries to organize an enquiry and identify useful records. They are general guidance, not project data or a substitute for site-specific professional review.
Conditions that commonly help or hinder GPR
| Site or survey factor | Potential effect | Planning response | Remaining uncertainty |
|---|---|---|---|
| Low-loss, less conductive ground | Radar energy may travel farther before attenuation | Consider target size, depth and antenna frequency | Actual depth still depends on site-specific properties |
| Clay-rich, saline or conductive wet ground | Strong attenuation can sharply limit depth | Use a suitability test and consider another method | A weak/absent reflector does not prove no target |
| Higher frequency | Finer resolution but generally less penetration | Match frequency to the smallest relevant target and expected depth | Field performance may differ from nominal assumptions |
| Lower frequency | Potentially deeper penetration with coarser resolution | Check whether the target can still be resolved | More depth does not guarantee target recognition |
| Known-depth reflector or velocity survey | Improves travel-time-to-depth calibration | Use calibration, common-midpoint or suitable reference evidence | Velocity can vary laterally and vertically |
| Surface objects and utilities | Air waves, clutter and interference can create misleading events | Map cultural features and verify targets independently | A hyperbola is not a unique object identity |
On a small screen, swipe the table sideways to review every column.
Source-derived relationship
GPR frequency tradeoff—qualitative only
A qualitative pathway linking antenna frequency, wavelength and resolution, attenuation and depth, calibration, and verified target interpretation.
- Frequency choiceTarget size, expected depth and site material
- Signal behaviourReflection, velocity, spreading and attenuation
- Radar sectionTravel time, amplitude, reflectors, clutter and migration
- Verified targetCalibration plus records, exposure or another method
Source basis and use boundary
The table deliberately avoids universal depth claims. GPR penetration can vary from very shallow to much deeper depending on conductivity, water/clay content, frequency, target and field conditions.
- U.S. EPA — Ground Penetrating Radar (GPR)Radar reflections, travel time, velocity calibration, attenuation, conductivity controls, resolution–penetration tradeoff, and interpretation ambiguity.
- U.S. EPA — Electromagnetic MethodsElectromagnetic-property response, signal propagation and attenuation, site conditions, survey configuration, and interpretation controls.
Primary sources reviewed 2 September 2026. Recheck the linked source and applicable project criteria before relying on current requirements.